Financial Crisis Observatory
The Financial Crisis Observatory (FCO) is a scientific platform aimed at testing and quantifying rigorously, in a systematic way and on a large scale the hypothesis that financial markets exhibit a degree of inefficiency and a potential for predictability, especially during regimes when bubbles develop.
starting from 5 Dec. 2013: Financial crisis risk monitoring and positive and negative bubble risk maps become available from the Financial Crisis Observatory.
These reports will not be updated anymore on this website!
Are you interested in continuing receiving
our future FCO outputs after the chair has closed?
You can register to our email list external pagehere.
2022
- 1st June 2022 FCO: DownloadGlobal Bubble Report (PDF, 5.7 MB)
- 1st May 2022 FCO: DownloadGlobal Bubble Report (PDF, 5.2 MB)
- 1st April 2022 FCO: DownloadGlobal Bubble Report (PDF, 6.8 MB)
- 1st March 2022: DownloadFCO Global Bubble Report (PDF, 5.1 MB)
- 1st February 2022: DownloadFCO Global Bubble Report (PDF, 4.4 MB)
- 1st January 2022: DownloadFCO Global Bubble Report (PDF, 4.7 MB)
2021
- 1st December 2021: DownloadFCO Global Bubble Report (PDF, 5 MB)
- 1st November 2021: DownloadFCO Global Bubble Report (PDF, 5 MB)
- 1st October 2021: DownloadFCO Global Bubble Report (PDF, 4.8 MB)
- 1st September 2021: DownloadFCO Global Bubble Report (PDF, 5 MB)
- 1st August 2021: DownloadFCO Global Bubble Report (PDF, 4.7 MB)
- 1st July 2021: DownloadFCO Global Bubble Status Report (PDF, 4.7 MB)
- 1st June 2021: DownloadFCO Global Bubble Status Report (PDF, 4.4 MB)
- 1st May 2021: DownloadFCO Global Bubble Status Report (PDF, 6.8 MB)
- 1st April 2021: DownloadFCO Global Bubble Status Report (PDF, 5.8 MB)
- 1st March 2021: DownloadFCO Global Bubble Status Report (PDF, 4.5 MB)
- 1st February 2021: DownloadFCO Global Bubble Status Report (PDF, 4.2 MB)
- 1st January 2021: DownloadFCO Global Bubble Status Report (PDF, 5.6 MB)
2020
- 1st December 2020: DownloadFCO Global Bubble Status Report (PDF, 8.9 MB)
- 1st November 2020: DownloadFCO Global Bubble Status Report (PDF, 2.1 MB)
- 1st October 2020: DownloadFCO Global Bubble Status Report (PDF, 5.5 MB)
- 1st September 2020: DownloadFCO Global Bubble Status Report (PDF, 5.3 MB)
- 1st August 2020: DownloadFCO Global Bubble Status Report (PDF, 5 MB)
- 1st July 2020: DownloadFCO Global Bubble Status Report (PDF, 4 MB)
- 1st June 2020: DownloadFCO Global Bubble Status Report (PDF, 2.9 MB)
- 1st May 2020: DownloadFCO Global Bubble Status Report (PDF, 1.8 MB)
- 1st April 2020: DownloadFCO Global Bubble Status Report (PDF, 1.9 MB)
- 1st March 2020: DownloadFCO Global Bubble Status Report (PDF, 3 MB)
- 1st February 2020: DownloadFCO Global Bubble Status Report (PDF, 4.8 MB)
- 1st January 2020: DownloadFCO Global Bubble Status Report (PDF, 6.6 MB)
2019
- 1st December 2019: DownloadFCO Global Bubble Status Report (PDF, 3.4 MB)
- DownloadNEW: The FCO Cockpit Global Bubble Status Report (November 2019) (PDF, 9.3 MB):
A collaboration of the Chair of Entrepreneurial Risks, ETH Zurich and Systematic Investment Management AG
- 1st October 2019: DownloadSynthesis report (PDF, 9.4 MB)
- 1st September 2019: DownloadSynthesis report (PDF, 5.1 MB)
- 1st August 2019: DownloadSynthesis report (PDF, 4 MB)
- 1st July 2019: DownloadSynthesis report (PDF, 4.2 MB)
- 1st June 2019: DownloadSynthesis report (PDF, 3.5 MB)
- 1st May 2019: DownloadSynthesis report (PDF, 9.6 MB)
- 1st April 2019: DownloadSynthesis report (PDF, 4.2 MB)
- 1st March 2019: DownloadSynthesis report (PDF, 3.8 MB)
- 1st February 2019: DownloadSynthesis report (PDF, 3.8 MB)
- 1st January 2019: DownloadSynthesis report (PDF, 3.8 MB)
2018
- 1st December 2018: DownloadSynthesis report (PDF, 3.2 MB)
- 1st November 2018: DownloadSynthesis report (PDF, 2.8 MB)
- 1st October 2018: DownloadSynthesis report (PDF, 3.9 MB)
- 1st September 2018: DownloadSynthesis report (PDF, 3.4 MB)
- 1st August 2018: DownloadSynthesis report (PDF, 5.4 MB)
- 1st July 2018: DownloadSynthesis report (PDF, 4.3 MB)
- 1st June 2018: DownloadSynthesis report (PDF, 2.5 MB)
- 1st May 2018: DownloadSynthesis report (PDF, 3.7 MB)
- 1st April 2018: DownloadSynthesis report (PDF, 3.3 MB)
- 1st March 2018: DownloadSynthesis report (PDF, 3.3 MB)
- 1st February 2018: DownloadSynthesis report (PDF, 3.8 MB)
- 1st January 2018: DownloadSynthesis report (PDF, 4.2 MB)
2017
- 1st December 2017: DownloadSynthesis report (PDF, 2.3 MB)
- 1st November 2017: DownloadSynthesis report (PDF, 2.6 MB)
- 24 October 2017: Downloadupdated version with index analyses (PDF, 2.5 MB)
1st October 2017: DownloadSynthesis report (PDF, 1.6 MB)
- 1st September 2017: DownloadSynthesis report (PDF, 5.8 MB)
- 1st August 2017: DownloadSynthesis report (PDF, 2.7 MB)
- 1st July 2017: DownloadSynthesis report (PDF, 3.4 MB)
- 1st June 2017: DownloadSynthesis report (PDF, 3.1 MB)
- 1st Mai 2017: DownloadSynthesis report (PDF, 3.1 MB)
- 1st April 2017: DownloadSynthesis report (PDF, 3.4 MB)
- 1st March 2017: DownloadSynthesis report (PDF, 2.5 MB)
- 1st February 2017: DownloadSynthesis report (PDF, 2.8 MB)
- 1st January 2017: DownloadSynthesis report (PDF, 4.3 MB)
2016
- 1st December 2016: DownloadSynthesis report (PDF, 3.5 MB)
- 1st November 2016: DownloadSynthesis report (PDF, 3.8 MB)
- 1st October 2016: DownloadSynthesis report (PDF, 2.8 MB)
- 1st September 2016: DownloadSynthesis report (PDF, 4.7 MB)
- 1st August 2016: DownloadSynthesis report (PDF, 2.6 MB)
- 1st July 2016: DownloadSynthesis report (PDF, 2.6 MB)
- 1st June 2016: DownloadSynthesis report (PDF, 1.3 MB)
- 1st May 2016: DownloadSynthesis report (PDF, 1.5 MB)
- 1st April 2016: DownloadSynthesis report (PDF, 1.1 MB)
- 1st March 2016: DownloadSynthesis report (PDF, 896 KB)
- 1st February 2016: DownloadSynthesis report (PDF, 1.1 MB)
- 1st January 2016: DownloadSynthesis report (PDF, 800 KB)
2015
- 1st December 2015: DownloadSynthesis report (PDF, 1.3 MB)
- 1st November 2015: DownloadSynthesis report (PDF, 733 KB)
- 1st October 2015: DownloadSynthesis report (PDF, 859 KB)
- 1st September 2015: DownloadSynthesis report (PDF, 1.2 MB)
- 1st August 2015: DownloadSynthesis report (PDF, 1.2 MB)
- 1st July 2015: DownloadSynthesis report (PDF, 1.2 MB)
- 1st June 2015: DownloadSynthesis report (PDF, 1.7 MB)
- 1st May 2015: DownloadSynthesis report (PDF, 1.3 MB)
- 1st April 2015: DownloadSynthesis report (PDF, 1.5 MB)
- 1st March 2015: DownloadSynthesis report (PDF, 1.2 MB)
- 1st February 2015: DownloadSynthesis report (PDF, 1.8 MB)
- 1st January 2015: DownloadSynthesis report (PDF, 1.1 MB)
2014
- 1st December 2014: DownloadSynthesis report (PDF, 722 KB)
- 1st November 2014: DownloadSynthesis report (PDF, 1.1 MB)
- 1st October 2014: DownloadSynthesis report (PDF, 1 MB) and Downloaddetailed calculations (PDF, 237 KB)
- Download1st April 2014 (PDF, 764 KB)
- Download1st February 2014 (PDF, 1.5 MB)
30 September 2013
DownloadThe graph (PDF, 61 KB) prepared on 27 September 2013 shows subsequent evolution of TSLA stock price and our LPPL indicator. It is clear that the LPPL indicator has correctly identified a change of regime, which is however not a crash, but a change of slope of the growth.
21 June 2013
The figure shows our DownloadAlarm Index Analysis on Tesla Motors Inc. (PDF, 126 KB)
It will be no surprise to see that the steep stock price rise over the last 2 months has been the result of a bubble. The alarm index confirms that there has been a feedback mechanism on the price resulting in a faster-than-exponential growth (the hallmark of a bubble). We are now in the regime shift. The alarm index dropped back to zero and the price shows high volatility. This is a critical situation. Since the Bernanke speech earlier this week, Global Markets are back in a risk-on mode (to say the least). Inflated high-tech stocks like Tesla (or LinkedIn) are particularly vulnerable during a global correction in stock markets.
Without judging the value of Tesla’s technology, innovation and management, it is a textbook example of a bubble.
See this paragraph from our recent article D. Sornette and P. Cauwels The Illusion of the Perpetual Money Machine, Notenstein Academy White Paper Series (Dec. 2012)
(external pagehttp://arxiv.org/abs/1212.2833 and external pagehttp://ssrn.com/abstract=2191509)
external page(Notenstein - White Paper_Series_041212.pdf)
"First, a novel opportunity arises. This can be a ground-breaking technology or the access to a new market. An initial strong demand from first-mover smart money leads to a first price appreciation. This often goes together with an expansion of credit, which further pushes prices up. Attracted by the prospect of higher returns, less sophisticated investors then enter the market. At that point, the demand goes up as the price increases, and the price goes up as the demand increases. This is the hallmark of a positive feedback mechanism. The behavior of the market no longer reflects any real underlying value and a bubble is born. The price increases faster and faster in a vicious circle with spells of short-lived panics until, at some point, investors start realizing that the process is not sustainable and the market collapses in a synchronization of sale orders. The crash occurs because the market has entered an unstable phase. Like a ruler held up vertically on your finger, any small disturbance could have triggered the fall."
It is also important to stress that in the same manner Tesla is the textbook example of the importance of bubbles in innovation and technological revolutions, as explained within our "social bubble" hypothesis [1-4].
If you look at the income statement of Tesla you see that the company has been losing money consequently. This is no surprise for such a high-tech startup.
If investors would only focus on fundamental value, Tesla would not be able to raise money through the stock-market. However, because of the anticipations, hence, the bubble effect on the price, investors are nevertheless attracted by expected profits. This would not be possible if the price would be fully fundamentally driven.
Social Bubbles:
[1] D. Sornette, Nurturing Breakthroughs; Lessons from Complexity Theory, Journal of Economic Interaction and Coordination 3, 165-181 (2008), DOI: 10.1007/s11403-008-0040-8 (external pagehttp://arxiv.org/abs/0706.1839)
[2] Monika Gisler and Didier Sornette, Exuberant Innovations: The Apollo Program, Society 46, 55-68 (2009), DOI: 10.1007/s12115-008-9163-8 external page(http://arxiv.org/abs/0806.0273 and external pagehttp://ssrn.com/abstract=1139807)
[3] Monika Gisler, Didier Sornette and Ryan Woodard, Innovation as a Social Bubble: The Example of the Human Genome Project, Research Policy 40, 1412-1425 (2011) (external pagehttp://arxiv.org/abs/1003.2882 and external pagehttp://ssrn.com/abstract=1573682)
[4] Monika Gisler and Didier Sornette, Bubbles Everywhere in Human Affairs, chapter in book entitled "Modern RISC-Societies. Towards a New Framework for Societal Evolution", L. Kajfez Bogataj, K.H. Mueller, I. Svetlik, N. Tos (eds.), Wien, edition echoraum: 137-153 (2010) (external pagehttp://ssrn.com/abstract=1590816)
12 June 2013
Prof. Didier Sornette presented external page"How we can predict the next financial crisis" at TEDGlobal 2013, "THINK AGAIN" in session 4 entitled "Money talks", hosted by Chris Anderson external pageTED Blog TED Blog on GLOBAL ISSUES
external pageTurbulent times ahead: Q&A with economist Didier Sornette
21 May 2013
DownloadS&P 500 in a bubble (PDF, 525 KB). Analysis by the FCO indicates that the US stock market index S&P 500 is growing at an unsustainable rate (8.3% gain in 4 weeks) and will soon correct.
November 2012
Silvano Cincotti, Didier Sornette, Philip Treleaven, Stefano Battiston, Guido Caldarelli and Cars Hommes and Alan Kirman, DownloadAn economic and financial exploratory (PDF, 7 MB), European Journal of Physics: Special Topics 214, 361-400 (2012)
5 December 2011 - FBE Blog
We have launched the next phase of our FBE. Instead of publishing a paper with forecasts every six months, we will make forecasts as we find them, be it daily, weekly or monthly. Each new FBE asset will be posted individually on our new blog at external pagehttp://fcofbe.blogspot.com/.
The first one is already posted. As in the first three papers, we initially will only publish the digital fingerprings of the analysis. Once the forecast window has passed, we will post the original analysis. As always, the timestamp issue is transparent and verifiable. Please visit this latest research vehicle.
3 May 2011 -Third FBE Results and Analysis
Here we present the analysis of the third set of FBE forecasts:
The Financial Bubble Experiment: Advanced Diagnostics and Forecasts of Bubble Terminations,
Volume III external page(http://arxiv.org/abs/1011.2882)
Main DownloadFBEReport (PDF, 3.4 MB)
Original assets Downloadreport (PDF, 721 KB) (run checksum on this file)
1 November 2010 - Second FBE Results and Analysis
Here we present the analysis of the second set of FBE forecasts:
Didier Sornette, Ryan Woodard, Maxim Fedorovsky, Stefan Reimann, Hilary Woodard, Wei-Xing Zhou (The Financial Crisis Observatory), The Financial Bubble Experiment: Advanced Diagnostics and Forecasts of Bubble Terminations Volume II - Master Document (external pagehttp://arxiv.org/abs/1005.5675)
DownloadMain FBEReport (PDF, 804 KB)
Original assets Downloadreport (PDF, 352 KB) (run checksum on this file)
(Please note that the version before 10:21 am 4 November 2010 was incorrect. The correct version is now above.)
3 May, 2010 - Initial FBE Results and Analysis
Here we present the analysis of the four initial FBE forecasts:
DownloadMain FBE Report (PDF, 3.7 MB)
Summary Slides
IBOVESPA (Brazil index) - Downloadfbe_001.pdf (PDF, 265 KB) (2 Nov. 2009)
Merrill Lynch EMU Corporates Non-Financial Index - Downloadfbe_002.pdf (PDF, 1.4 MB) (2 Nov. 2009)
Gold spot price in USD - Downloadfbe_003.pdf (PDF, 1.9 MB) (2 Nov. 2009)
Cotton future in USD - Downloadfbe_004.pdf (PDF, 1.2 MB) (22 Dec. 2009)
Media coverage of the Financial Bubble Experiment
1 November 2009
We introduce a new experiment involving the forecasts of the end of bubbles in financial time series using techniques developed over the past 15 years. The majority of forecasts that we have made in the past have been published after we found them to be successful. That is, we have predicted certain bubbles to end and then have written about the post-mortem analysis. In this new experiment, we propose a new method of delivering our forecasts where the results are revealed only after the predicted event has passed but where the original date when we produced these same results can be publicly, digitally authenticated. More information can be found in the first delivery of external pagetheFinancial Bubble Experiment.
The Financial Crisis: How Much Longer and Deeper?
In this section we look at important papers, links and discussions and add our own comments.
Highlighted Papers
external pageD. Sornette, Dragon-Kings, Black Swans and the Prediction of Crises, in press in the International Journal of Terraspace Science and Engineering (2009), (http://arXiv.org/abs/0907.4290)
Featured on the FT blog external page"Dragon-king of the outlier events"
external pageDidier Sornette and Ryan Woodard, Financial Bubbles, Real Estate bubbles, Derivative Bubbles, and the Financial and Economic Crisis (2009), (http://arxiv.org/abs/0905.0220), to appear in the Proceedings of APFA7 (Applications of Physics in Financial Analysis). This conference series, organized by Misako Takayasu and Tsutomu Watanabe, focuses on the analysis of large-scale Economic data, (http://www.thic-apfa7.com/en/htm/index.html)
Past analysis and forecasts
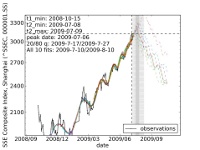
external pageCHINESE EQUITY (10 July 2009)
Amid the current financial crisis, there has been one equity index beating all others: the Shanghai Composite. Our analysis of this main Chinese equity index shows clear signatures of a bubble build up and we go on to predict its most likely crash date: July 17-27, 2009 (20%/80% quantile confidence interval). See full analysis and results in this external pagepaper.
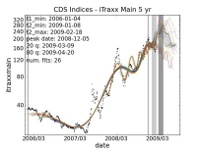
DownloadCDS (PDF, 169 KB) (19 February 2009)
Our analysis has been performed on data kindly provided by Amjed Younis of Fortis on 19 February 2009. It consists of 3 data sets: credit default swaps (CDS); German bond futures prices; and spread evolution of several key euro zone sovereigns. The date range of the data is between 4 January 2006 and 18 February 2009. Our log-periodic power law (LPPL) analysis shows that credit default swaps appear bubbly, with a projected crash window of March-May, depending on the index used. German bond futures and European sovereign spreads do not appear bubbly. (See Downloadreport (PDF, 169 KB) for more information.)
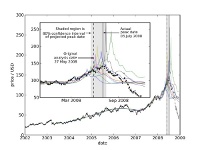
external pageOIL (27 May 2008)
Oil prices exhibited a record rise followed by a spectacular crash in 2008. The peak of $145.29 per barrel was set on 3 July 2008 and a recent low of $40.81 was scraped on 5 December, a level not seen since 2004. On 27 May 2008, we addressed the question of whether oil prices were exhibiting a bubble-like dynamics, which may be symptomatic of speculative behavior, using our techniques based on statistical physics and complexity theory. More thorough post-crash analysis of our 27 May 2008 experiment predicts a peak within an 80% confidence interval between 17 May 2008 and 14 July 2008. The actual observed `crash', where prices began a long downward trend, began on the last day of this period. (See external pagepaper for more information).
external pageUS REAL ESTATE (3 June 2005)
We analyzed the quarterly average sale prices of new houses sold in the USA as a whole, in the northeast, midwest, south, and west of the USA, in each of the 50 states and the District of Columbia of the USA, to determine whether they have grown faster-than-exponential which we take as the diagnostic of a bubble. We find that 22 states (mostly Northeast and West) exhibit clear-cut signatures of a fast growing bubble. From the analysis of the S&P 500 Home Index, we conclude that the turning point of the bubble will probably occur around mid-2006. (See external pagepaper for more information)
external pageUS AND UK REAL ESTATE (March 2003) In the aftermath of the burst of the “new economy” bubble in 2000, the Federal Reserve aggressively reduced short-term rates yields in less than two years from 6.5 to 1.25 % in an attempt to coax forth a stronger recovery of the US economy. But, there is growing apprehension that this is creating a new bubble in real estate, as strong housing demand is fuelled by historically low mortgage rates. Using the theory of critical phenomena resulting from positive feedbacks in markets, we confirm this view point for the US but find that mayhem may be in store for the UK: we unearth the unmistakable signatures (log-periodicity and power law super-exponential acceleration) of a strong unsustainable bubble there, which could burst around the end of the year 2003. (See external pagepaper for more information)